Showing posts with label Spectrophotometers. Show all posts

Wednesday, March 25, 2009

SPECTRO Portable Spectrophotometer

The SPECTRO Spectrophotometer is a portable spectrophotometer that is easier to use and more accurate than anything in its price range. The portable spectrophotometers use a menu driven display where tests and functions are selected from scrolling menus for ultimate simplicity. The portable spectrophotometer’s results are displayed as a %T, absorbance, and concentration. The portable spectrophotometer comes with over 40 pre-programmed tests and up to 25 calibrations for additional tests can be entered into its memory. You can also customize sequences for frequently run tests. The portable spectrophotometers automatically move the grating to the required wavelength for your convenience.
portable spectrophotometer
The SPECTRO Spectrophotometer has a wide wavelength range, 350-1000nm, and is highly accurate over the entire range, + 2nm. The portable spectrophotometers also have a high resolution (1 nm with 5nm bandpass over entire range), holds calibration longer (modified Ebert mounting, 1200 lines/mm grating), is better for higher absorbance samples (-0.1 to 2.5A photometric range), and has better linearity for higher concentrations (+ 0.005A continuous photometric accuracy). The porable spectrophotometer has an optional carrying case and rechargeable battery pack.

Portable Spectrophotometers Specifications

Instrument Type: Single beam spectrophotometer
Readout: 4 line, 20 characters per line LCD
Wavelength Range: 350-1000 nm
Wavelength Accuracy: + 2nm
Wavelength Resolution: 1 nm
Wavelength Bandwidth: 5nm (max)
Photometric Range: 0-125%T, –0.1-2.5A
Photometric Accuracy: + 0.005nm
Photometric Stray Light: <0.5%T
Dispersive Device: 1200 lines/mm ruled grating
Sample Chamber: Accepts 25 mm diameter flat-bottomed test tubes, 10 mm square cuvettes, 16 mm COD test tubes
Source Lamp: Quartz halogen
Modes: %/T, ABS, pre-programmed tests
Pre-Programmed Tests: YES, with automatic wavelength selection
User Defined Tests: Up to 25 tests
RS232 Port: 8 pin mDIN
Power Requirements Battery Operation (optional): Ni-Metal Hydride battery pack
Line Operation: 110/220V, 60/50 Hz
Aprovals: CE and EPA
Dimensions: 14 ¼”x11”x6 ¾” (36cmx28cmx17cm)
Weight: 10.3 lbs (4.65 kg)

SMART2 COLORIMETER Product Description

The SMART2 Colorimeter is a user-friendly handheld colorimeter that is an ideal direct reading colorimeter for complete on site water analyses. All pre-programmed tests can be run on the compact hand held colorimeters and each test features automatic wavelength selection the entire multi-LED optical system is embedded in the light chambers and optimized for the test reagent systems. You can simply select the test and put in the sample with reagent. The handheld colorimeter’s microprocessor, which selects the wavelength, also allows you to load up to 10 tests for analyzing custom reagent systems.
handheld colorimeters
The SMART2 Colorimeter uses a simple menu driven display to show the user the over 70 pre-programmed tests on the 4 line LCD screen. The hand held colorimeters are also able to display diagnostic error messages such as over/under range and messages regarding the blank sample. The handheld colorimeters have an integral datalogger that can be accessed via the SMARTLink 2 software and the RS232 port built into the hand held colorimeter’s housing. An optional carrying case is available for the handheld colorimeter.

Colorimeter Specifications
Instrument Type: Colorimeter
Readout: Graphical 4 line, 16 character per line LCD
Keypad: 6-button membrane switch
Wavelengths: 430nm, 520 nm, 570 nm, and 620 nm
Wavelength Accuracy: ± 2 nm
Readable Resolution: Determined by reagent system
Wavelength Bandwidth: 10 typical
Photometric Range: -2 to 2 Absorbance Units (AU)
Photometric Resolution: 1% FS
Photometric Accuracy: 2% FS
Sample Chamber: Accepts 25 mm diameter flat-bottomed test tubes, 10 mm square cuvettes, 16 mm COD test tubes
Light Sources: 4 LEDs
Detectors: 4 silicon photodiodes with integrated interference filters
Modes: Absorbance, pre-programmed tests
Pre-Programmed Tests: YES, with automatic wavelength selection
User Defined Tests: Up to 10 user tests can be input
Data Logger: 350 test results stored for download to a PC
RS232 Port: 8 pin mini-DIN
Power: 9 volt alkaline or AC adapter
Line Operation: 110/ AC; 50/60 Hz with adapter, 6V 500 mA DC
Dimensions: (LxWxH) 8.5 x 16.2 x 16.7 cm, 3.4 x 6.4 x 2.6 inches
Weight: 312 g, 11 oz (colorimeter only)

INTRODUCTION TO COLORIMETRIC ANALYSIS & SPECTROSCOPY

Most test substances in water are colorless and undetectable to the human eye. To test for their presence we must find a way to “see” them. A colorimeter or spectrophotometer can be used to measure any test substance that is itself colored or can be reacted to produce a color. In fact a simple definition of colorimetry is “the measurement of color” and a colorimetric method is “any technique used to evaluate an unknown color in reference to known colors”. In a colorimetric chemical test the intensity of the color from the reaction must be proportional to the concentration of the substance being tested. Some reactions have limitations or variances inherent to them that may give misleading results. Most limitations or variances are discussed with each particular test instruction. In the most basic colorimetric method the reacted test sample is visually compared to a known color standard. However, the eyesight of the analyst, inconsistencies in the light sources, and the fading of color standards limit accurate and reproducible results.

To avoid these sources of error, a colorimeter or spectrophotometer can be used to photoelectrically measure the amount of colored light absorbed by a colored sample in reference to a colorless sample (blank). A colorimeter is generally any tool that characterizes color samples to provide an objective measure of color characteristics. In chemistry, the colorimeter is an apparatus that allows the absorbance of a solution at a particular frequency (color) of visual light to be determined. Colorimeters hence make it possible to ascertain the concentration of a known solute, since it is proportional to the absorbance.

A spectrophotometer is a photometer (a device for measuring light intensity) that can measure intensity as a function of the color, or more specifically, the wavelength of light. There are many kinds of spectrophotometers. Among the most important distinctions used to classify them are the wavelengths they work with, the measurement techniques they use, how they acquire a spectrum, and the sources of intensity variation they are designed to measure. Other important features of spectrophotometers include the spectral bandwidth and linear range. The most common application of spectrophotometers is the measurement of light absorption.

White light is made up of many different colors or wavelengths of light. A colored sample typically absorbs only one color or one band of wavelengths from the white light. Different chemical substances absorb varying frequencies of the visible spectrum. Only a small difference would be measured between white light before it passes through a colored sample versus after it passes through a colored sample. The reason for this is that the one color absorbed by the sample is only a small portion of the total amount of light passing through the sample. However, if we could select only that one color or band of wavelengths of light to which the test sample is most sensitive, we would see a large difference between the light before it passes through the sample and after it passes through the sample. Colorimeters rely on the principle that the absorbance of a substance is proportional to its concentration i.e., a more concentrated solution gives a higher absorbance reading.

Global Water’s spectrophotometer uses a quartz halogen lamp as the source of white light. The white light passes through an entrance slit and is focused on a ruled grating consisting of 1200 lines/mm. The grating causes the light to be dispersed into its various component wavelengths. The monochromator design allows the user to select which specific wavelength of interest will be passed through the exit slit and into the sample. The use of mirrors and additional filters prevents light of undesired wavelengths (overtones, stray light) from making it to the sample. A photodetector measures the amount of light, which passes through the sample.

Global Water’s colorimeters pass a colored light beam through an optical filter, which transmits only one particular color or band of wavelengths of light to the colorimeter’s photodectector where it is measured. The difference in the amount of monochromatic light transmitted through a colorless sample (blank) and the amount of monochromatic light transmitted through a test sample is a measurement of the amount of monochromatic light absorbed by the sample. In most colorimetric tests the amount of monochromatic light absorbed is directly proportional to the concentration of the test factor producing the color and the path length through the sample. However, for a few tests the relationship is reversed and the amount of monochromatic light absorbed is inversely proportional to the concentration of the test factor.

The choice of the correct wavelength for testing is important. It is interesting to note that the wavelength that gives the most sensitivity (lower detection limit) for a test factor is the complementary color of the test sample. For example the Nitrate-Nitrogen test produces a pink color proportional to the nitrate concentration in the sample (the greater the nitrate concentration, the darker the pink color). A wavelength in the green region should be selected to analyze this sample since a pinkish-red solution absorbs mostly green light.

The Dobson Spectrophotometer

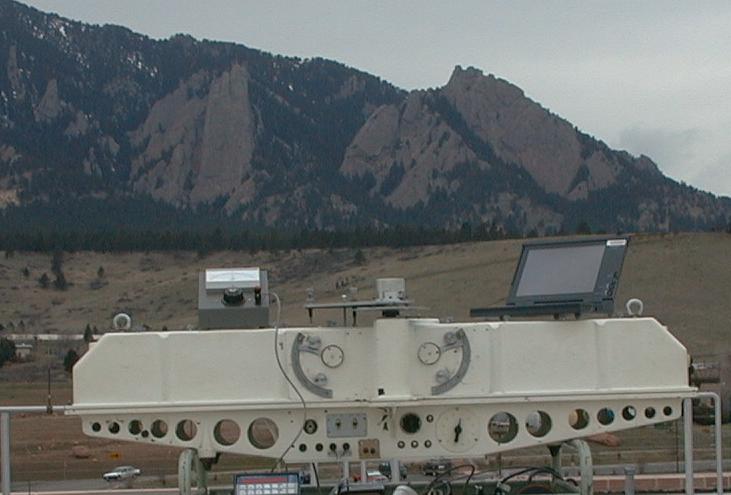
The earliest Dobson Spectrophotometer was built in the mid-1920s by G.M.B. Dobson for the purpose of investigating atmospheric circulation by measuring changes in atmospheric ozone. This ground-based instrument measures column ozone by the technique of differential absorption of ultraviolet (UV) light with the sun (or moon) as a light source.By comparing the UV light intensity at wavelengths that are strongly absorbed and weakly absorbed by ozone, the column ozone content of the atmosphere. a photo of a Dobson Spectrophotometer

is accurately determined. In addition to the 16 ESRL Cooperative Dobson Network stations, total column ozone is measured from about 80 sites around the world. Most of the Dobson instruments in use today have calibrations that are traceable to Dobson No. 83 that is maintained as the World Standard Dobson by ESRL as part of the World Meteorological Organization (WMO) designated World Dobson Calibration Facility.

The earliest record of continuing total column ozone observations dates back to 1925 at Arosa, Switzerland. This record and a number of other long-term measurements dating back 40 years have provided a valuable context for understanding ozone changes of the past two decades. They have also provided important continuity for a number of satellite-borne total ozone instruments that have been deployed in recent decades. Most of the ground-based total ozone instruments are part of the WMO coordinated Global Atmosphere Watch program.

Using a Spectronic 20 spectrophotometer

The Spectronic 20 spectrometer is widely used in teaching laboratories. The specific instructions will differ with other models, but the principles remain.
  1. The instrument must have been warm for at least 15 min. prior to use. The power switch doubles as the zeroing control.
  2. Use the wavelength knob to set the desired wavelength. Extreme wavelengths, in the ultraviolet or infrared ranges, require special filters, light sources, and/or sample holders (cuvettes).
  3. With the sample cover closed, use the zero control to adjust the meter needle to "0" on the % transmittance scale (with no sample in the instrument the light path is blocked, so the photometer reads no light at all).
  4. Wipe the tube containing the reference solution with a lab wipe and place it into the sample holder. Close the cover and use the light control knob to set the meter needle to "0" on the absorbance scale.
  5. Remove the reference tube, wipe off the first sample or standard tube, insert it and close the cover. Read and record the absorbance, not the transmittance.
  6. Remove the sample tube, readjust the zero, and recalibrate if necessary before checking the next sample.

Why use a reference solution? Can't you just use a water blank? A proper reference solution contains color reagent plus sample buffer. The difference between the reference and a sample is that the concentration of the assayable substance in the reference solution is zero. The reference tube transmits as much light as is possible with the assay solution you are using. A sample tube with any concentration of the assayable substance absorbs more light than the reference, transmitting less light to the photometer. In order to obtain the best readability and accuracy, the scale is set to read zero absorbance (100% transmission) with the reference in place. Now you can use the full scale of the spectrophotometer. If you use a water blank as a reference, you might find that the assay solution alone absorbs so much light relative to distilled water that the usable scale is compressed, and the accuracy is very poor.

Principles of Spectrophotometry

A spectrophotometer consists of two instruments, namely a spectrometer for producing light of any selected color (wavelength), and a photometer for measuring the intensity of light. The instruments are arranged so that liquid in a cuvette can be placed between the spectrometer beam and the photometer. The amount of light passing through the tube is measured by the photometer. The photometer delivers a voltage signal to a display device, normally a galvanometer. The signal changes as the amount of light absorbed by the liquid changes.

If development of color is linked to the concentration of a substance in solution then that concentration can be measured by determining the extent of absorption of light at the appropriate wavelength. For example hemoglobin appears red because the hemoglobin absorbs blue and green light rays much more effectively than red. The degree of absorbance of blue or green light is proportional to the concentration of hemoglobin.

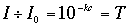
When monochromatic light (light of a specific wavelength) passes through a solution there is usually a quantitative relationship (Beer's law) between the solute concentration and the intensity of the transmitted light, that is,

Principles of Spectrophotometry

where I sub 0 is the intensity of transmitted light using the pure solvent, I is the intensity of the transmitted light when the colored compound is added, c is concentration of the colored compound, l is the distance the light passes through the solution, and k is a constant. If the light path l is a constant, as is the case with a spectrophotometer, Beer's law may be written,
Principles of Spectrophotometry
where k is a new constant and T is the transmittance of the solution. There is a logarithmic relationship between transmittance and the concentration of the colored compound. Thus,
Principles of Spectrophotometry
The O.D. is directly proportional to the concentration of the colored compound. Most spectrophotometers have a scale that reads both in O.D. (absorbance) units, which is a logarithmic scale, and in % transmittance, which is an arithmetic scale. As suggested by the above relationships, the absorbance scale is the most useful for colorimetric assays.

Tuesday, March 24, 2009

Spectrophotometer Simulation

The experiment models the emission of photons by a lamp, the absorption of those photons by a solute in a sample solution, and the detection of the photons by a photomultiplier tube. The photons are represented by little balls (a particulate matter model rather than a wave model). The simulation permits the simultaneous use of two different wavelengths.

The user may specify several operating conditions for the spectrophotometer.

  • Sample
    • Blank
        The molar absorptivity is zero for both wavelengths.
    • Unknown 1
        The wavelength and molar absorptivity are selected by the applet (the molar absorptivity is not shown to the user). The second wavelength is not used.
    • Unknown 2
        Same as Unknown 1
    • User Entered
        The user may specify both wavelengths and both molar absorptivities
  • Wavelength
      The wavelength of the photon in nanometers may be specified. The color of the "photon" is selected to loosely correspond with the wavelength.
  • Molar Absorptivity (L mole-1 cm-1)
  • Concentration (millimole L-1)
  • Cell Path Length (cm)
  • Intensity (photons/sec)
      The intensity is the number of photons per second emitted from the source.
  • To use the applet

    1. Select the desired sample.
    2. Start the simulation by clicking on the green button in the lower right corner of the applet.
    3. The intensity of photons reaching the detector may be measured using the timer in the lower left corner of the applet.

    Operational Notes and Tips

  • The first wavelength and molar absorptivity (left-most boxes) are always active. The wavelength must always lie in the range of 380 to 780 nm. The second wavelength can be disabled by entering a wavelength of 0.
  • When measuring an intensity after changing the operating conditions (e.g., concentration, cell path length, source intensity, or molar absorptivity), all sufficient time for the existing photons to cross the screen before starting or reseting the time.
  • On slow computers the animation of the photons can become jerky and photons may be released from the lamp in waves rather than randomly; this behavior can be especially pronounced when two different wavelengths and a high intensity of photons are used. These problems can be compounded by an operating system such as Windows 95 that is sluggish in switching tasks. To remedy or alleviate this problem, try
    • Operating the simulation with a lower intensity
    • Closing all other applications, thereby freeing more CPU time for the simulation.
    • Reboot the system (especially for Windows 95/98) to eliminate all unnecessary background processes.
  • Monday, March 23, 2009

    Inductively-Coupled Plasma

    Schematic of an AES experiment
    Atomic emission spectroscopy (AES or OES [optical emission spectroscopy]) uses quantitative measurement of the optical emission from excited atoms to determine analyte concentration. Analyte atoms in solution are aspirated into the excitation region where they are desolvated, vaporized, and atomized by a flame, discharge, or plasma. These high-temperature atomization sources provide sufficient energy to promote the atoms into high energy levels. The atoms decay back to lower levels by emitting light. Since the transitions are between distinct atomic energy levels, the emission lines in the spectra are narrow. The spectra of samples containing many elements can be very congested, and spectral separation of nearby atomic transitions requires a high-resolution spectrometer. Since all atoms in a sample are excited simultaneously, they can be detected simultaneously using a polychromator with multiple detectors. This ability to simultaneously measure multiple elements is a major advantage of AES compared to atomic-absorption (AA) spectroscopy.

    Raman Spectroscopy Introduction

    You are already aware that photons interact with molecules to induce transitions between energy states. In the discussion of Raman spectroscopy, we use language from particle theory and we say that a photon is scattered by the molecular system. Most photons are elastically scattered, a process which is called Rayleigh scattering. In Rayleigh scattering, the emitted photon has the same wavelength as the absorbing photon. Raman Spectroscopy is based on the Raman effect, which is the inelastic scattering of photons by molecules. The effect was discovered by the Indian physicist, C. V. Raman in 1928. The Raman effect comprises a very small fraction, about 1 in 107, of the incident photons. In Raman scattering, the energies of the incident and scattered photons are different. A simplified energy diagram that illustrates these concepts is given below.
    energy diagram
    The energy of the scattered radiation is less than the incident radiation for the Stokes line and the energy of the scattered radiation is more than the incident radiation for the anti-Stokes line. The energy increase or decrease from the excitation is related to the vibrational energy spacing in the ground electronic state of the molecule and therefore the wavenumber of the Stokes and anti-Stokes lines are a direct measure of the vibrational energies of the molecule. A schematic Raman spectrum may appear as:

    schematic Raman spectrum
    In the example spectrum, notice that the Stokes and anti-Stokes lines are equally displaced from the Rayleigh line. This occurs because in either case one vibrational quantum of energy is gained or lost. Also, note that the anti-Stokes line is much less intense than the Stokes line. This occurs because only molecules that are vibrationally excited prior to irradiation can give rise to the anti-Stokes line. Hence, in Raman spectroscopy, only the more intense Stokes line is normally measured.

    Infrared (IR) and Raman spectroscopy both measure the vibrational energies of molecules but these method rely only different selection rules. Recall that for a vibrational motion to be IR active, the dipole moment of the molecule must change. Therefore, the symmetric stretch in carbon dioxide is not IR active because there is not change in the dipole moment. The asymmetric stretch is IR active due to a change in dipole moment.

    For a transition to be Raman active, there must be a change in polarizability of the molecule.

    polarizability of the molecule


    Notice that the symmetric stretch in carbon dioxide is Raman active because the polarizability of the molecule changes. You can see when you compare the ellipsoid at the equilibrium bond length to the ellipsoid for the extended and compressed symmetric motions. For a vibration to be Raman active, the polarizability of the molecule must change with the vibrational motion. Thus, Raman spectroscopy complements IR spectroscopy.

    Experimentally, we only observe the Stokes shift in a Raman spectrum. Recall that the Stokes lines will be at smaller wavenumbers (or higher wavelengths) than the exciting light. Since the Raman scattering is not very efficient, we need a high power excitation source such as a laser. Also, since we are interested in the energy (wavenumber) difference between the excitation and the Stokes lines, the excitation source should be monochromatic. This is another property of many laser systems.

    Tuesday, March 17, 2009

    ONYX UV-2100 Spectrophotometer

    ONYX UV-2100 Spectrophotometer

    FEATURES

    • Double beam, fully-automated scanning system
    • Compatible PC controlled, full-featured analytical software.
    • Wavelength Scan: Scanning sample spectra in any range within 190 to 900nm. Three scanning speeds: Fast, Middle and Slow selectable, with min. sampling interval of 0.04nm. Data processing functions include derivative spectra and smoothing, peak picking, spectrum expansion and superposition and other arithmetic calculations.
    • Fixed wavelength measurement: Maximum of 10 wavelengths can be set at the same time.
    • Kinetic measurement: Wavelengths and sampling intervals selectable; activity calculation available.
    • Quantitation: Standard factor method, standard contrast method, 2-wavelength method, and 3-wavelength method, etc.

    SPECIFICATIONS:

    • Wavelength range: 190 to 900nm
    • Spectral Bandwidth: 0.1, 0.2, 0.5, 1.0, 2.0nm
    • Wavelength accuracy: ±0.3nm
    • Wavelength Reproducibility: 0.15nm
    • Photometric Accuracy: ±0.3%T (0-100%T), ±0.002A(0-0.5A), ±0.004A(0.5A-1A)
    • Photometric Reproducibility: 0.001A(0-0.5A)
    • Working mode: T, A (-0.3-4A), E
    • Stray Light: <=0.05%T(NaI, 220nm)
    • Baseline Flatness: ±0.001A
    • Stability: 0.0004A/h (at 500nm, after warming up)
    • Detector: photomultiplier
    • Light source: deuterium lamp, tungsten lamp
    • Power: AC: 220V/50Hz, 110V/60Hz, 400W
    • Dimensions: 670x470x210mm
    • Weight: 45kg

    ONYX UV-1600 Spectrophotometer

    ONYX UV-1600 Spectrophotometer

    FEATURES

    • Double beam, fully automated scanning system.
    • Wavelength Scan: Scanning sample spectra in any range within 190 to 900nm, with data processing functions of peak picking.
    • Fixed Wavelength Measurement: Maximum of 7 wavelengths can be set at the same time.
    • 21 standard curves can be made.
    • Kinetic Measurement: Wavelengths and sampling intervals selectable
    • Automatic 10mm 8-cell holder design
    • The measured data can be printed out. RS-232 interface available for connecting a computer.

    SPECIFICATIONS:

    • Wavelength Range: 190 to 1100nm
    • Spectral Bandwidth: 2.0nm
    • Wavelength Accuracy: ±0.5nm
    • Wavelength Reproducibility: 0.2nm
    • Photometric Accuracy: ±0.3%T(0-100%T)
    • Photometric Reproducibility: 0.2%T
    • Working Mode: T, A, C, E
    • Stray Light: 0.1(NaI, 220nm)
    • Baseline Flatness: ±0.003A
    • Stability: <=0.002A/30min (at 500nm, after warming up)
    • Detector: Silicon photodiode
    • Power:AC: 220V/50Hz, 110V/60Hz, 180W
    • Dimensions: 570x415x140mm
    • Weight: 26kg

    ONYX UV-1201 Spectrophotometer

    ONYX UV-1201 Spectrophotometer

    FEATURES

    • Automatic wavelength scanning, automatic lamp changeover, automatic cell holder.
    • Three spectral bandwidths can be selected.
    • Automatic wavelength shift calibration, automatic energy adjustment.
    • Cell error correction can be made.
    • Special UV software which can be operated in windows98/ME/2000/XP system.
    • Wavelength Scan: Scanning sample spectra in any range within 190 to 1100nm. Derivative spectra, peak picking, curve smoothing, spectrum expansion and overlaying, and other calculation can be carried out to the scanned spectrum.
    • Fixed wavelength measurement: Maximum of 10 wavelengths can be set at the same time.
    • Quantitation: Standard curve method, K-factor method, dual-wavelengths and triple-wavelengths method can be used.
    • Kinetic measurement can be carried out with selectable wavelength sampling interval. The minimum sampling interval is 0.1sec. The activity calculation can be made.
    • Printer and RS-232 interface provided.

    SPECIFICATIONS:

    • Wavelength range: 190 to 850nm
    • Spectral Bandwidth: 0.5, 1, 2nm
    • Wavelength accuracy: ±0.5nm
    • Wavelength Reproducibility: =0.3nm
    • Photometric Accuracy: ±0.5%T
    • Photometric Reproducibility: =0.3%T
    • Working mode: T, A (-0.342~3A), C, E
    • Stray Light: <=0.5%T(NaI, 220nm)
    • Baseline Flatness: ±0.005A (200~800nm)
    • Stability: <=0.005A/30min (at 500nm)
    • Detector: Photomultiplier
    • Light source: deuterium lamp, tungsten lamp
    • Power: AC: 220V/50Hz, 110V/60Hz, 250W
    • Dimensions: 635x407x175mm
    • Weight: 30kg

    ONYX AF-610A Atomic Fluorescence Spectrophotometer

    ONYX AF-610A Atomic Fluorescence Spectrophotometer
    Sensitive, accurate and fast determination of As, Hg, Se, Cd, Pb, Sb, Te, Sn, Zn, Ge and Bi

    APPLICATIONS
    * Drinking water (water quality analysis)
    Detection of heavy metal elements (Hg,As,Se,Pb)
    * Environment monitoring
    Pollution research in soil, water and air etc..(As,Sb,Hg,Se,Te,Pb,Sn,Ge)
    * Geology
    General survey, detailed survey and abnormal evaluation in mine locating. (As, Sb, Bi, Hg, Se, Te, Pb, Sn, Ge)
    * Clinical medicine
    Micro elements in blood, hair, urine and tissue. (Se, Ge, As, Hg, Pb)
    * Agriculture environmental protection
    Grain, seeds, vegetables, soil and pesticide. (As, Hg, Se, Sb)
    * Commodity inspection and food
    Cosmetics, metal, meat, fish, alcoholic drink, milk products (As, Hg, Se, Pb,Ge)
    * Metallurgy
    Harmful elements in metal. (As, Bi, Pb, Sb, Sn etc.)

    FEATURES
    * The advanced continuous flow, discrete sample injection system with single pump control, wye mixing module (patented technique), provides simple structure, clear flow path and convenient operation, eliminating the need of using a special discharge pump and the trouble of flow rate matching.
    * The spraying jet type hydride generation and three-step gas-liquid separating system (patented technique) with much higher reaction efficiency, features thorough gas-liquid separation, automatic waste liquid discharge, improving the sensitivity and precision effectively.
    * Unique Ar-H2 flame automatic ignition device (patented technique) improves analytical sensitivity effectively and reduces gaseous interference and memory effect greatly.
    * Infrared heating quartz atomizer (patented technique) with much longer operating life and good stability.
    * Accurate peristaltic pump flow control device to ensure stable running and accurate sampling.
    * Double-cathode HCL with super-intensive short pulse power supply is be used as the light source to improve the analytical sensitivity and stability.
    * Large-sale logic array and highly integrated modular electric circuit design.
    * Provides automatic gas line protection and alarm.
    * Newly designed rotary auto-sampler with simple structure and excellent performance is available for user's choice.
    * Computer control and rich data processing functions. Compatible computer communicates with the main unit via a standard RS-232 serial port. Windows operating software provides data, graphic, condition storage and expert system. Multi-windows processing technique provides the possibility of simultaneous display of signal profile, measurement results and curve fitting pages etc.

    SPECIFICATIONS:
    * Detection limit (µg/L):
    1. Hg =0.003
    2. Cd =0.001
    3. As, Sb, Bi, Se, Te, Pb, Sn =0.03
    4. Ge =0.3
    5. Zn =2.0

    * Precision: =1%
    * Linear dynamic range: 3 orders of magnitude
    * Dimensions: 880x460x480mm
    * Weight: 75kg

    Environment Requirements
    * Ambient temperature: 5~35?
    * Relative humidity: less than 85%
    * Good ventilating facility
    * Without strong electric-magnetic interference
    * Power supply: 220v±10%, 50Hz

    Standard Setup

    * Main Unit: 1 set
    * Computer: 1 set
    * Printer: 1 set
    * High intensity hollow cathode lamps: 2 pcs.
    * Accessories: 1 kit

    ONYX WLD-2C ICP SPECTROMETER

    ONYX WLD-2C ICP SPECTROMETER
    Usage:

    The ICP Emission Spectrometer is an automated analytical instrument for analyzing microelements and trace elements. It has a wide range of applications, and can be used in the fields of environmental monitoring, chemicals, geology, agriculture, pharmaceuticals, biology, foodstuffs, metallurgy and many others.

    Features:

    * High sensitivity, low detection limit of 10-8~10-10 g/ml.
    * High precision with RSD less than 1.5%.
    * Minimal matrix effect.
    * Wide analyzable concentration range of 4~5 orders of magnitude.
    * Simultaneous analysis of multi-elements
    * Dynamic background correction to eliminate spectral interference.
    * Integrated data collection control board is located inside the computer, ensuring strong resistance to interference.

    Technical Data:

    * RF generator
    Oscillating frequency 40MHZ
    Power output 0.7~1.2KW
    Power output stability Less than 0.5%

    * Polychromator

    Paschen-Runge mounting
    Concave grating: Curvature radius: 750mm
    Ruled density: 2400/mm
    Size: 30 x 50 mm
    Dispersion: 0.55nm/mm (1st order)
    Wavelength range: 190~500nm
    Constant temperature: 30°C±0.5°C

    * Measuring System
    Measuring mode: sectional integration
    Measuring accuracy: 0.2%
    Dynamic range: 106
    * Computer system
    PII IBM compatible computer, printer and data collection control board.
    Application software: Windows 95/98 operating system, standard Windows application software.
    * Basic functions of the analytical software:
    Spectrum scanning (manual and automatic);
    Working curve establishment;
    Working curve calibration;
    Background correction ( blank method, dynamic method );
    Quantitative analysis ( curve method, standard addition method);
    Spectral interference correction (coefficient method, kalman filter method)./span>

    In Situ Ultraviolet Spectrophotometer (ISUS)

    The ISUS is a sensor used to measure concentrations of dissolved chemicals directly from their Ultraviolet Absorption Spectrum ( Johnson and Coletti, 2002). A variety of chemicals absorb light in the UV and each of these chemicals has a unique absorption spectrum. We can determine the concentration of these chemicals directly, with no chemical manipulation, by measuring the absorption spectrum of seawater in the UV and then deconvolving the spectra to yield the concentration of each component.

    ISUS Sensor with anti-fouling filter

    ISUS has been used to determine nitrate concentrations while deployed on CTD/Rosette profilers, undulating towed vehicles such as a SeaSoar or SeaSciences Acrobat, and on deep-sea moorings. It has also been used to measure sulfide flux from cold seeps in Monterey Bay while deployed on the Remotely Operated Vehicle Ventana.

    In Situ Ultraviolet Spectrophotometer (ISUS)

    Real-time nitrate data from an ISUS deployed on the MBARI M1 mooring is also available. There are two processors running for this data: one written by Luke Coletti (CGI application ) that includes interactive fitting of nitrate and can also be used to compare nitrate concentrations to other properties such as temperature, fluorescence and CO2; and one written by Ken Johnson (Visual Basic script) that compares the real-time data to historical observations in Monterey Bay.

    To learn more about ISUS read our paper in Deep-Sea Research and check Luke Coletti's home page for several posters that have been written about ISUS. To learn about applications of ISUS to studies of phytoplankton primary production, we have another paper in Deep-Sea Research.

    Monday, March 16, 2009

    Forensic Application of Near-Infrared Spectroscopy: Aging of Bloodstains

    The age of a bloodstain can be used to establish the time when a crime was committed. As blood ages, deoxyhemoglobin (HbO2) is converted into methemoglobin (MetHb), which is evident by the color change from red to brown. Human blood from vein and capillary vessels was used in this investigation. Samples were prepared by placing blood on substrates such as gauze and glass. Near-infrared (NIR) spectra of the samples were measured periodically at ambient conditions for one month.near-infrared spectrum-fr

    Determining the age of a bloodstain is of great interest in forensic science because the age could enable crime scene investigators to deduce the timeframe in which a crime was committed. The overall goal of our research on bloodstains is to explore the feasibility of developing a portable optical instrument that will be capable of predicting the age of stains found at crime scenes. This hypothetical handheld instrument will measure optical signals (spectra) reflected from a stain and use previously determined calibration data to predict its age. Before the concept of this instrument can be implemented, it is necessary to determine optical properties of blood, which might be used for predicting the age.

    The problem of estimating the age of bloodstains has been paramount since the early years of modern forensic methods (1,2). Currently, either a sample of a stain or both the stain and its substrate are sent to a laboratory for analysis. The most widely used analytical method is high performance liquid chromatography (HPLC), which focuses on the relative height of a peak due to a degradation product (3–5). Degradation of RNA has been used successfully to estimate age on the order of years (6); however, this is a time-consuming effort and not adaptable to field applications. Other laboratory instruments such as atomic force microscopy (AFM) (7), oxygen electrodes for measuring hemoglobin (8), and electron paramagnetic resonance (EPR) (9) have been used successfully in the laboratory. However, a portable, field-adaptable instrument for the rapid determination of the age of bloodstains does not exist.

    Blood represents about 8% of total body weight and has an average volume of 5 L in women and 5.5 L in men (10,11). It is a transport medium for dissolved or suspended material and travels from the heart to tissues and cells of the body through the distributed blood vessels. Erythrocytes, or red blood cells, are characterized by their primary function of O2 transport in the blood. Red blood cells are fully packed with hemoglobin, which is an iron-containing molecule that can bind with O2 loosely and reversibly (10,11). Because O2 is poorly soluble in blood, hemoglobin is indispensable for O2 transport. Hemoglobin consists of four highly folded polypeptide chains (the globin portion) and four iron-containing heme groups (protoporphryn molecules), each of which is bound to one of the polypeptides. Each of the four iron atoms found in heme can combine reversibly with one molecule of O2; therefore, each hemoglobin molecule can pick up four O2 molecules. Oxygen binds loosely with one of the six coordination bonds of the iron atoms. Hemoglobin is also a pigment that is naturally colored and because of its iron content, it appears reddish when combined with O2. Red blood cells are about 8 μm in diameter, and there are a million hemoglobin molecules in one erythrocyte.

    As blood ages, deoxyhemoglobin is converted into methemoglobin, which is evident by the color change from red to brown (10,11). Deoxyhemoglobin is actually a deoxygenated heme group that lacks O2 binding to its iron atom. Methemoglobin is a brownish-red form of hemoglobin that occurs when hemoglobin is oxidized during decomposition. The oxidation of Fe2+ to Fe3+ creates methemoglobin. Oxidized iron lacks an electron to bind oxygen effectively; thus, methemoglobin accumulation can impair tissue oxygenation (11). The Fe3+ in methemoglobin binds water rather than oxygen (12,13).

    In trying to develop an optical instrument for determining the age of bloodstains, we explored the potential of using the visible, near-infrared (NIR), and mid-infrared (IR) optical regions. There are obvious visible spectral changes as blood ages; the other components of blood such as water and proteins do not have specific bands in the visible region and there is a lack of bands for referencing the magnitude of the color change. The mid-IR region does have very characteristic bands due to proteins and water; however, it was found that the relative spectral changes depended upon the type of blood. For example, blood from veins demonstrated well-defined changes as a function of time, whereas blood from capillaries exhibited very little change other than the loss of water with time. In the NIR region, similar spectral changes were observed for vein and capillary blood samples. The investigations on hemoglobin in the NIR region of 1100–2500 nm has been very limited (14,15). Most investigations of hemoglobin focused on the visible and short-wavelength NIR with the goal of developing oximeters for noninvasive monitor of oxygen transmittal by hemoglobin (16–19).

    Surface Enhanced Raman Spectroscopy

    .Principles of Raman Spectroscopy
    Raman scattering of light by molecules may be used to provide information on a sample's chemical composition and molecular structure.

    Conventional Raman spectroscopy suffers from low signal strength, compared with other forms of optical spectroscopy such as fluorescence. As such it is not well suited to investigate molecular conformation in solution at low concentrations, which is a frequent requirement in life sciences. Surface Enhanced Raman Scattering (SERS) can increase the Raman signal by as much as 14 orders of magnitude, making SERS an attractive tool for future bio-physical investigation.

    Molecules absorbed onto specific metallic substrates (typically silver, gold and copper) exhibit enhanced in Raman signal. Enhancements reported as high as 1014.

    Increase in signal generated by chemical and electromagnetic field enhancement of vibrational modes.
    It is not clear whether enhancement mechanisms effect information derived from Raman spectra.

    Comparison of Raman and SERS spectra
    SERS using colloidal silver has been widely reported and is an ideal substrate for performing measurements in solution. When a solution of the sample molecule is mixed with a metal colloid the molecules are absorbed onto the surface of the colloids. The molecule is required to obtain molecular resonance and the surface attachment provides enhancement by interaction with the plasmons on the metal surface. Combined enhancement processes provide a Raman signal of equivalent sensitivity to that of fluorescence.

    Raman Spectroscopy of Carbon — More Information Than You Would Think

    What is curious about the Raman spectrum of carbon is that even though the spectra of these materials is actually quite simple, they have been found to be quite useful. To quote Ferrari in his review (1), "The Raman spectra of all carbon systems show only a few prominent features, no matter the final structure, be it a conjugated polymer or a fullerene. The spectra appear deceivingly simple: just a couple of very intense bands in the 1000–2000 cm–1 region and few other second-order modulations. However, their shape, intensity, and positions allow us to distinguish a hard, amorphous carbon from a metallic nanotube, giving as much information as that obtained by a combination of other lengthy and destructuive approaches. The peculiar dispersion of the π electrons in graphene is the fundamental reason why Raman spectroscopy in carbons is always resonant and, thus, a powerful and efficient probe of their electronic properties, not only of their vibrations."

    Principles of Raman Spectroscopy Principles of RamanDifferent carbon materials are used in various engineering applications, from high tech to low tech. Films are used as tribological coatings; fibers are used in composites for their strength; and nanotubes and graphene are being explored for use in microelectronics. Carbon composites have wide-ranging uses from aerospace to athletic gear. The ability of Raman spectroscopy to characterize these materials, in situ, with high spatial resolution (better than 1 μm) can be, and is being, exploited during development and QC.

    The Raman spectra of the various allotropes of carbon are best understood in the framework of solid-state physics.

    Diamond has the same structure as silicon and germanium, with two atoms in the unit cell. All C–C bonds are tetrahedral (sp3 ) and the lattice is cubic, so there is one triply degenerate optical phonon at the center of the Brillouin zone. As expected, the phonon frequency scales inversely with the mass of the element — 1332 cm–1 for carbon (diamond), 521 cm–1 for silicon, and 300 cm–1 for germanium.

    Graphite is composed of stacks of planes of sp2 -bonded carbon with the layers staggered (some atoms of one layer sit atop the centers of the hexagonal rings of adjacent layers) in an ABAB arrangement. There are two planes in the unit cell, and the symmetry is D46h. There are two doubly degenerate, Raman-active, in-plane, E2g modes, with frequencies of 1582 and 42 cm–1, the former being known as the "G" mode. The lower frequency mode corresponds to shear motion of the two planes and can only be observed in instruments capable of recording frequencies well below 100 cm–1.

    A continuum of structures of sp2 -bonded carbon has been observed, manufactured, and characterized. If one starts with graphite and grinds it into smaller crystallites, a "disorder" or D band appears (2) somewhere in the vicinity of 1280 and 1400 cm–1, depending upon the excitation wavelength (3). This band originally was assigned to scattering from the normally forbidden edge of the Brillouin zone, but was allowed because of the limited size of the crystallites. However, boron-doped crystals, in which the boron atoms are substitutional, also exhibit this behavior, which argues for symmetry breaking, rather than disorder or reduced crystallite size. In disordered materials, there is also a band at about 1620 cm–1, which often is called the "D'" band. A careful analysis of all the observations, including the inequivalence of the Stokes and anti-Stokes frequencies, indicates that a more coherent explanation invokes "double resonances" with electronic transitions (4).

    The spectra of carbon fibers (made, for example, by pyrolyzing polyacrylonitrile) show the features described previously. Carbon fiber composites often are glued together with pyrolyzed organic resin that was impregnated in carbon fiber cloth previously, or by carbon deposited by chemical vapor deposition (CVD). The Raman spectrum of the deposited carbon also can be characterized by recording the G and D bands.

    Tuesday, March 10, 2009

    Calibrating the Wavelength of Spectrometer

    This technical note will describe how to calibrate the wavelength of your spectrometer. Each spectrometer is calibrated before it leaves Ocean Optics, but like all spectrometers, the wavelength will drift slightly due to time and environmental conditions. To recalibrate your spectrometer, just follow these simple steps:

    What you are doing:

    The relationship between pixel number and wavelength is a second-order polynomial ...

    ... where l is the wavelength of pixel p, I is the wavelength of pixel 0, C1 is the first coefficient (nm/pixel) and C2 is the second coefficient (nm/pixel2). You will be calculating the value for I and the two Cs.

    What you will need:

    • A light source that produces spectral lines. Ocean Optics offers a portable Mercury-Argon lamp that is ideal for this purpose. Please contact us and ask about part number HG-1. If you do not have an HG-1, you will need a spectral line source that produces several (at least 3-5) spectral lines in the wavelength region of your spectrometer.
    • Your spectrometer.
    • An optical fiber -- for spectrometers without a built in slit, a 50 micron fiber works best.
    • Either a spreadsheet program (Excel or Quattro Pro, for example) or a calculator that performs second-order linear regressions. If you are using Microsoft Excel, make sure that you have installed the Add-In called "Analysis Tool-Pack."

    What you will need to do:

    • After placing OOIBase into Scope Mode, take a spectrum of your light source. Adjust A/D conversion frequency or integration time until there are several peaks on the screen that are not off-scale.
    • Move the cursor to one of the peaks and carefully position it so that it is at the point of maximum intensity. Record the pixel number that is displayed in the status bar. Repeat this step for all of the peaks in your spectrum.
    • Using your spreadsheet, create a table like the one shown below. In the first column, place the exact wavelength of the spectral lines that you used. Most calibration line sources come with a wavelength calibration sheet. If you do not have a wavelength calibration sheet, you can probably find the wavelengths for your spectral lines (assuming that they are being produced by pure elements) in the CRC Handbook of Chemistry and Physics. In the second column of this worksheet, place the observed pixel number. In the third column, place the pixel number squared.

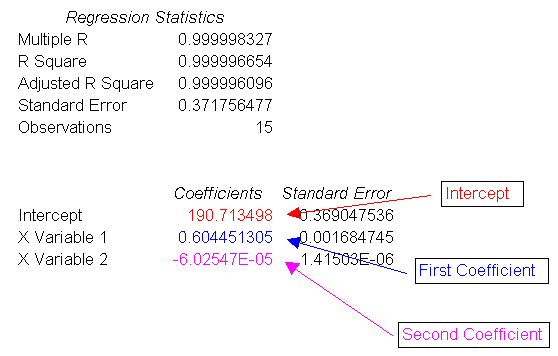
    • Now you are ready to calculate the wavelength calibration coefficients. In your spreadsheet program, find the functions to perform linear regressions (in Quattro Pro, look under Tools|Advanced Math, in Excel, it is in the Analysis Toolpack). Select the true wavelength as the dependent variable (Y). Select BOTH the pixel number and pixel number squared as the independent variables (X). After you execute the regression, an output similar to the one shown below is obtained.

    pc2000_4.gif (5403 bytes)

    • The numbers of importance are indicated in the above figure. You will need to record the Intercept as well as the First and Second Coefficients. Also, look at the value for R squared. It should be VERY close to 1. If it is not, you have probably assigned one of your wavelengths incorrectly.
    • Select the menu option Setup|Configure Spectrometer to update the wavelength coefficients within OOIBase.
    • Repeat this process for each channel in your spectrometer.

    Spectrometer Calibration

    Spectrometer Calibration

    It is important to regularly re-calibrate spectrometers to ensure measurement accuracy. Wavelength reflectance standards offer an affordable and easy way of doing this.

    To re-calibrate using a wavelength standard, the user simply measures the calibrated standard as if it were a sample. The standard provides a known peak wavelength and intensity at that wavelength. Comparing the value of the known standard to the spectrometer result allows the necessary instrument re-calibration to be identified.

    Constant wavelength values are created through the addition of one or more rare earth oxides to a reflectance material. This oxide displays a sharp absorption spikes at one or more specific wavelengths. Complete absorption data is supplied with each standard. The standard my have one wavelength value or multiple values.

    For example, Labsphere offers single wavelength standards of holmium oxide for UV-Vis-NIR calibrations, dysprosium oxide for NIR calibrations, and erbium oxide for Vis-NIR calibrations or all three for a multi-component wavelength standard for NIR reflectance spectrometer re-calibration.
    Bookmark and Share